: rendered at 18,000 X 12,000 :

This map is also a hexagon quilt projection map like the first. The difference is that I used the other tessellation and I rotated it 90 degrees.
View the Google Map of Oakland, California.
+ MORE
| FRONT PAGE |
GEOSPATIAL ART |
DC HISTORY / TIMELINE |
NEWS |
COLONIST |
FOUND MAPS |
FRACTALS |
|
PHOTOGRAPHY |
ANTIQUE |
DESIGN |
VIDEO |
|
CONTACT |
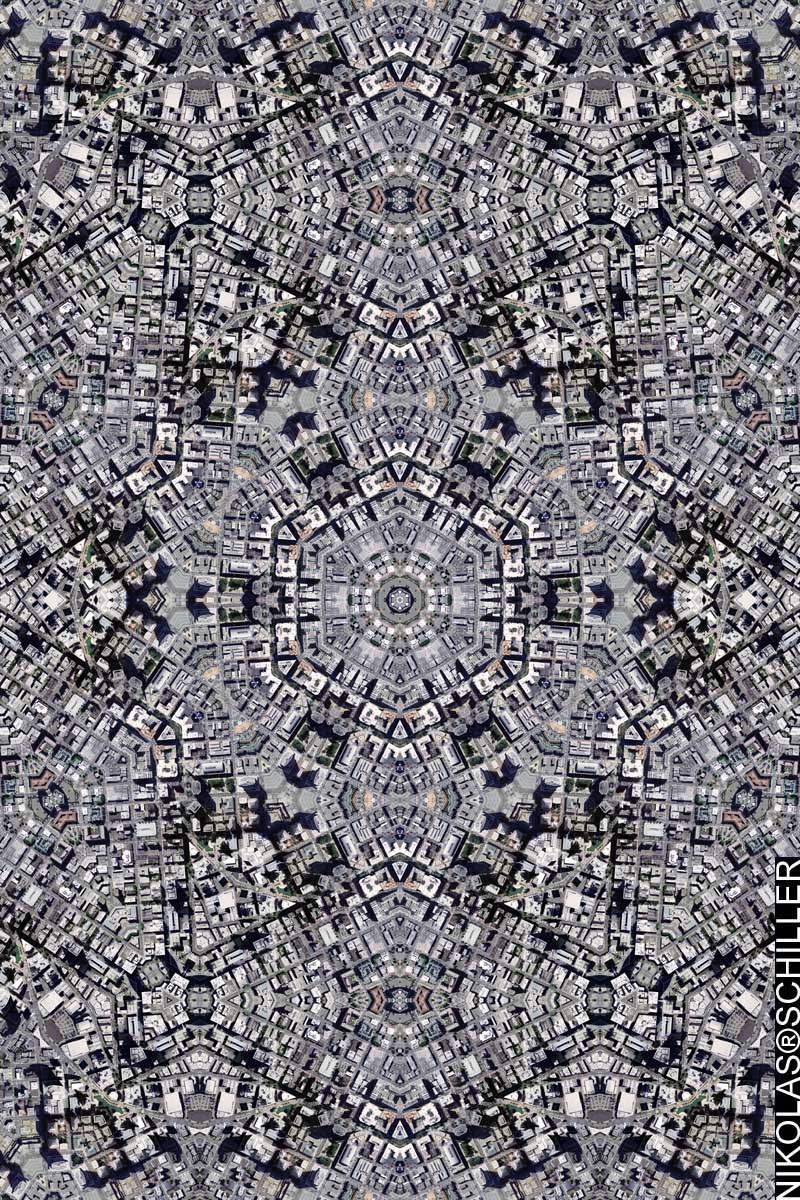
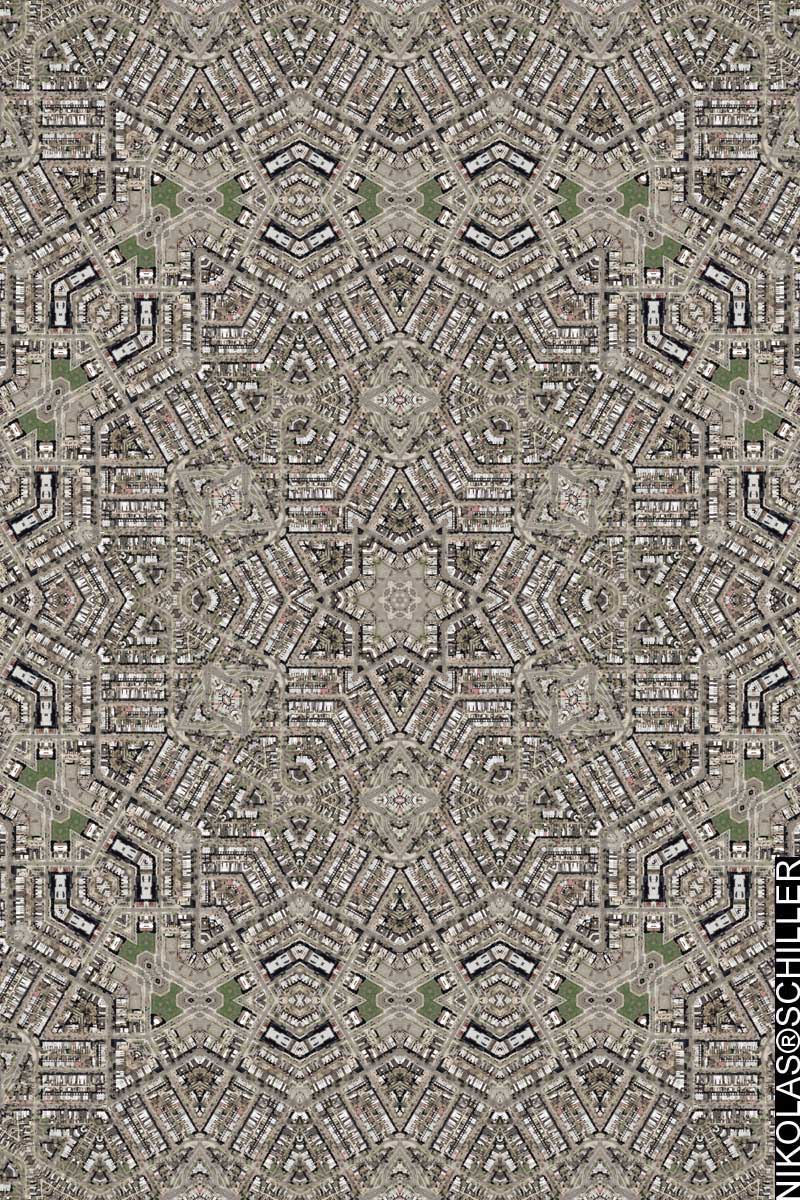
Oakland Quilt #2
|| 4/19/2007 || 11:46 am || Comments Off on Oakland Quilt #2 || ||
This map is also a hexagon quilt projection map like the first. The difference is that I used the other tessellation and I rotated it 90 degrees.
View the Google Map of Oakland, California.
+ MORE
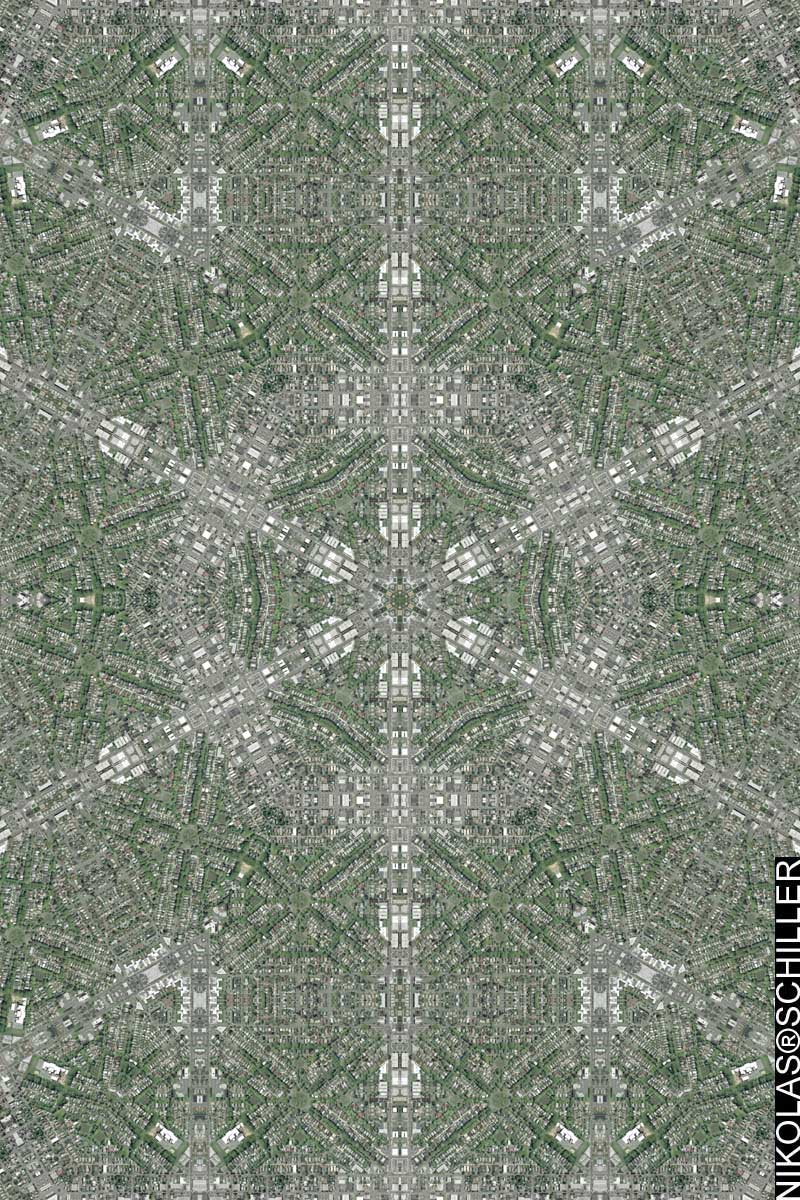
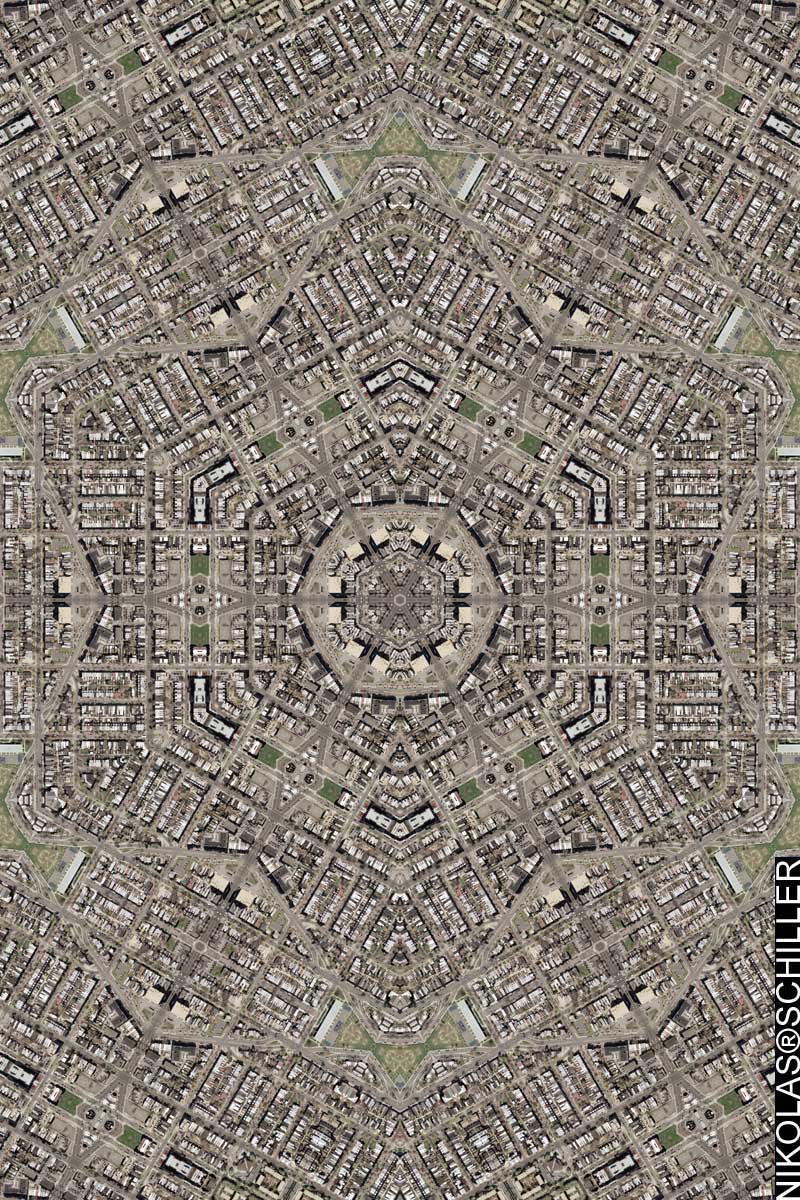
Oakland Quilt
|| || 10:53 am || Comments Off on Oakland Quilt || ||
I decided to try to see how many maps I could make in one day. In the past when I made multiple maps of a specific geography I would post one each subsequent day, however I am now able to make maps a bit more quickly now, so I am going post the 4 I made yesterday/last night. Originally I made two different tessellatons of city center in Oakland, California. This map is the only on that features the first tessellation, and is the only map to use it.
View the Google Map of Oakland, California.
+ MORE
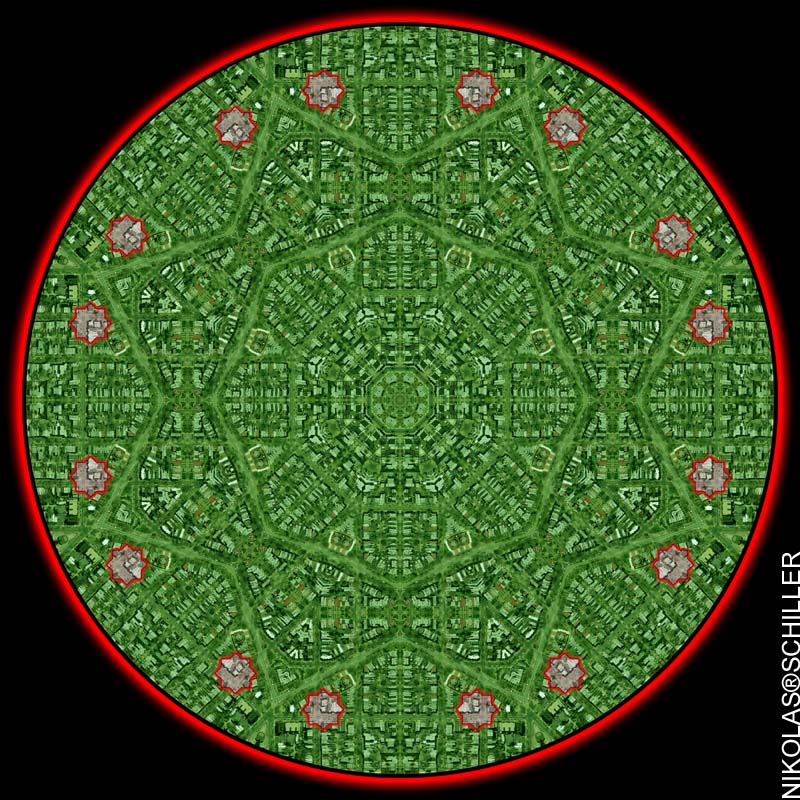
Ladd’s Addition Quilt
|| 4/15/2007 || 10:53 pm || Comments Off on Ladd’s Addition Quilt || ||
I couldn’t resist it. I wanted to see how fast my new computer could churn out a map. My old iMac would process a map in about 6 hours if left alone, but it usually ended up being about 10 hours per map. My new MacBook made this map in 3 hours flat. This is great news! I can now make multiple maps per day! I doubt I will, but it’s the fact that from imagery acquisition, tessellation, rendering, and post processing the entire process to make a map is now down to about 5 hours or less. Compared to the 10-15 hours of yesteryear, this is a huge leap forward, and I’m excited about what will be next.
A few weeks ago my friend Lynda was over at my house and we were sharing our formative geographies. As she was scrolling over to her family’s house in Portland, Oregon, she passed by Ladd’s Addition and I stopped her to find out more about that location. Like Park La Brea, the layout is geometric and I couldn’t help but make a mental note that I was going to revisit that locale again.
After doing some cursory research, I found that the layout was created by nineteenth century Mayor of Portland, William Sargent Ladd, and modelled after, of all places, Washington, DC. This will be the 3rd map that was inspired by L’Enfant- the other two are the ones of Indianapolis, Indiana (which were designed by his apprentice Alexander Ralston). I might make a derivative map, not sure yet. I just got Oakland’s central business district…..
View the Google Map of Ladd’s Addition in Portland, Oregon.
+ MORE
Capitol Hill Mandala, first draft
|| 4/9/2007 || 3:27 pm || Comments Off on Capitol Hill Mandala, first draft || ||
A couple weeks ago a visitor contacted me about places where she could see my maps printed out. After finding that she ived here in DC, I invited her & her husband over to look at some of the maps I have in my house. After viewing the lot, they really liked the one I made of Park City, Utah and asked if I would make one of their house that looked similar. This is the first draft. I will post the subsequent drafts as they are made….
The development of the tile I used to for this draft is actually something akin to an advancement in my own artistic endeavors. I originally made two tiles to be used- one that featured a diamond and the other featured a 16 sided polygon. I ended up using the 16-sided polygon to surround the house because it looked similar to the centers of the maps I’ve created using the Octagon Quilt Projection. The advancement I speak of is that by using an 16 sided polygon shape and having octagonal symmetry, I, for the first time, have created a unique geometric illusion.
In the Park City map I used a hexagon to outline the house and as one moves their eyes around the map they can see the hexagon rotates in conjunction with the symmetry used in the map. The illusion is that the houses rotate inside of the polygon but the polygon itself does not!
For example, along 45 degree line of symmetry, a hexagon or diamond would be rotated 45 degrees (while still being a hexagon or diamond in shape), however, in this map the polygon does not rotate because the polygon has exactly twice the number of lines of symmetry being employed in the map. Only upon closer inspection can one see that the contents of the polygon rotate along the lines of symmetry, while the polygon itself does not.
+ MORE
Quilt of Charleston South Carolina
|| 4/1/2007 || 4:18 pm || Comments Off on Quilt of Charleston South Carolina || ||
I’ve waited for some time for this imagery to be released and I am somewhat disappointed that it was released at .6 meters per pixel (roughly 2 feet per pixel). This spatial resolution allows for more area to be covered, so the benefit was that I able to get most of the southern portion of the city covered.
On a different note, I’ve found a slight limitation with WordPress’ category naming system. For each map I’ve made a category for both the city and state, with the state being the parent category. Months ago I made a couple quilts of Charleston, West Virginia and I found that I could not add another category named Charleston because it technically already existed even though it was nested with West Virginia. I was thinking of naming the category “Charleston2” or “CharlestonSC,” but I haven’t yet. I will figure something out….
View the Google Map of Charleston, South Carolina.
+ MORE
Home Quilt #6
|| 3/30/2007 || 3:23 pm || Comments Off on Home Quilt #6 || ||
This is the 10th map of my neighborhood and I think it’s the 3rd fractal. It turned out perfectly- minus the fact that I acciddentally yanked the power plug to my external hard drive and had to start the rendering all over again… My next map should be of Charleston, South Carolina.
View the Google Map of the Shaw neighborhood in Washington, DC.
Related Maps:
– Home Quilt
– Home Quilt #2
– Home Quilt #3
– Home Quilt #4
– Home Quilt #5
– U Street, NW
– U Street, NE
– U Street, SW
– U Street, SE
+ MORE
Home Quilt #5
|| 3/29/2007 || 3:22 pm || Comments Off on Home Quilt #5 || ||
It’s been well over a year since I’ve made any maps of my neighborhood and with this installment I’ll have 9 maps that feature the rowhouse I live in.
This is the first quilt projection using the 2005 imagery of Washington, DC and I’m quite pleased with how it turned out. Sadly, the “NO WAR” brickwork on my rooftop is not present, but at .16 meters per pixel it’s rich with detail. Up next will be #6 based off of a derivative tessellation created from this map. Like the White House and the U.S. Capitol, I can now say that I beat google maps to my house :)
View the Google Map of the Shaw neighborhood in Washington, DC.
Related Maps:
• Home Quilt
• Home Quilt #2
• Home Quilt #3
• Home Quilt #4
• U Street, NW
• U Street, NE
• U Street, SW
• U Street, SE
+ MORE
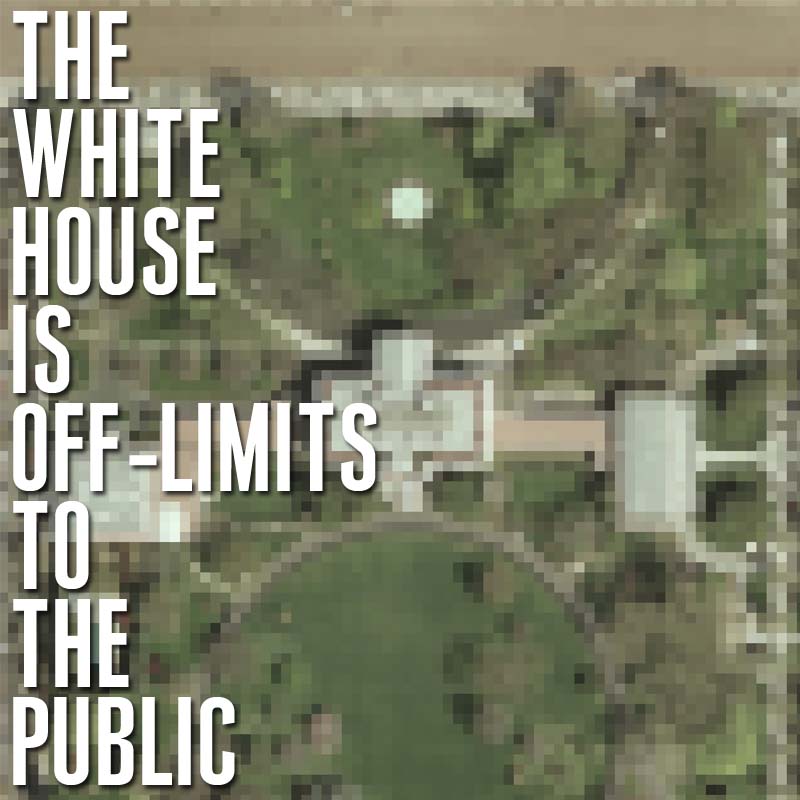
The White House is Off-Limits to the Public: An Exploration of Censorship’s Perimeter
|| 3/26/2007 || 3:32 pm || Comments Off on The White House is Off-Limits to the Public: An Exploration of Censorship’s Perimeter || ||
The U.S. Capitol is Off-Limits to the Public: An Exploration of Censorship’s Perimeter
|| 3/25/2007 || 9:46 am || Comments Off on The U.S. Capitol is Off-Limits to the Public: An Exploration of Censorship’s Perimeter || ||
THE GEOCOLONIAL SLOTS – Match 3 for Statehood!
|| 3/22/2007 || 9:36 am || Comments Off on THE GEOCOLONIAL SLOTS – Match 3 for Statehood! || ||
I mentioned that I was thinking about doing some sort of gambling themed lost project. And after about 7 different random image generator scripts I settled on this one. On Firefox & Safari it doesn’t appear to work as I intended. When attempting to gamble for representation I found that the images were not randomly loading. So you will probably have to manually hit reload for equality. I tried a few different javascripts to directly reload the page, but none worked. So I am stuck with this slightly substandard geographic casino. Casinos are substandard anyways; just like taxation without representation.
This interactive geographic environment consists of the 2 types of map details from my Washington, DC map collection. The folder consists of the {name}-zoom.jpg, {name}-zoom2.jpg, {name}-cut.jpg, {name}-cut2.jpg– related to each map. The Zooms represent central details that geographic tessellations at two different scales. The Cuts are details of places and spaces around the map. The 144 different Zooms & Cuts were placed into 3 folders: right, middle, left. Each time the page reloads there is a 1 out of a 2,865,984 chance of winning statehood!
+ MORE
©2004-2026 Nikolas R. Schiller - Former Colonist of the District of Columbia - Privacy Policy - Fair Use - RSS - Contact
::LAST 51 POSTS::
53 queries. 0.580 seconds.
Powered by WordPress


::THE QUILT PROJECTION::
Square |
Diamond |
Hexagon |
Octagon |
Dodecagon |
Beyond |
::OTHER PROJECTIONS::
The Lenz Project |
Mandala Project |
The Star Series |
Abstract Series |
Memory Series
|
Mother Earth Series
|
|
Misc Renderings
 |
::POPULAR MAPS::
- The Los Angeles Interchanges Series::MONTHLY ARCHIVES::
::LOCATIONS & CATEGORIES::

