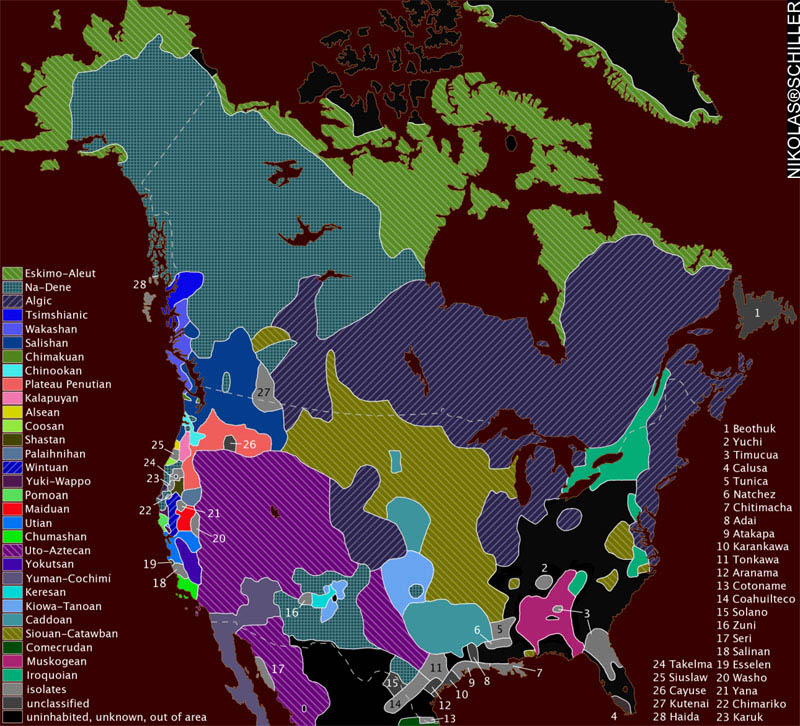
Map Created by Wikipedia User ish ishwar in 2005, using the GIMP software.
Click to view original map.
I came across this map of the Indigenous Languages of North America the other night and it reminded me of my previous entry related to the map of the languages of Europe.
According to the Wikipedia entry on the map:
about sources
Map redrawn and modified primary based on two maps by cartographer Roberta Bloom appearing in Mithun (1999:xviii-xxi). Incidentally, these maps are very derivative of the Driver map of the 1950s-60s (which means that, although published in 1999, it is not as up-to-date as one might think). The other main source used is the up-to-date and very well-done map found in Goddard (1996), which was revised as Goddard (1999). Essentially, Bloom’s map was used for the projection and general outline of language borders while Goddard’s maps were used to adjust Bloom’s borders to reflect the more recent research.
Additional references include Sturtevant (1978-present), Mithun (1999:606-616), and Campbell (1997:353-376). Mithun and Campbell have several maps based on the maps found in Sturtevant (1978-present) and Bright (1992).
about map content
— Map delineates each language family in a unique color.
— Language isolates are all in dark grey, e.g. Chitimacha (#7) is an isolate in Louisiana. This is not meant to imply any relationship among them whatsoever. All isolates are assigned a number and listed on the right side of map.
Unclassified languages (i.e. #1 Beothuk, #4 Calusa, #8 Adai, #10 Karankawa, #12 Aranama, #15 Solano, #19 Esselen, #26 Cayuse) are in light grey and are also assigned a number and listed with the isolates on the right. (Unclassified languages in the case of North America are unclassified because there is not sufficient data to determine genealogical relationship.)
— Areas in white are either
1. uninhabited (in Alaska, Canada, Greenland),
2. unknown (due to early extinction and little or no data; this is mostly in the East), or
3. outside of subject area (in Mexico). (note that Seri (#17) is included because it is usually considered part of the Southwest culture area and also included in various Hokan phylum proposals.)
— This is a historical map: Although most languages are still spoken in North America, the extent of their distribution has been profoundly affected by European contact — many languages have become extinct (sometimes including even the peoples).
— Language areas are those at earliest time of European contact, as far as can be determined. Since contact occurred at different times in different areas, no historical Native American maps of the entire continent are of a single time period.
Language areas are not as well-defined as this map would suggest: borders are often fuzzy and arbitrary and the entire language area may not be fully occupied by language speakers.
— Na-Dene here is Athabaskan-Eyak-Tlingit, excluding Haida (#28).
— The following groupings are disputed by some (or are considered not fully demonstrated):
1. Plateau Penutian (aka Shahapwailutan) = Klamath-Modoc (isolate) + Molala (isolate) + Sahaptian (family). Sometimes Cayuse (#26) is included in Plateau Penutian, but this language is not very well documented and is now extinct. Thus, it is considered unclassified here.
2. Yuki-Wappo = Yuki (isolate) + Wappo (isolate).
Note: Since I inverted the color scheme when publishing this map, the white is black and the grey is still grey.
What struck me about this map was how many languages were spoken in North America before European colonization. I’m curious about how similar and dissimilar some of the languages were to each other, but alas, I can never hear all of them now. When it comes to the spatial proximity of the language isolates with languages of larger tribes, I’m curious as to how these languages were able to remain linguistically different. While some tribes travelled each year between summer and winter cities, I would imagine that there was some interaction- either through peaceful trade or warfare. Sadly, most of that information has been lost, but I’m glad some researchers have taken the time to attempt to draw the map above.
+ MORE


Google Maps: Add the Contour Interval to the Legend of your Terrain maps
|| 8/6/2009 || 3:56 pm || 5 Comments Rendered || ||
Nearly every printed topographic map I’ve ever looked at has the contour interval, otherwise known as the distance between contour lines, listed in the legend. Depending on the scale of the map, the contour interval ranges from 1 foot to hundreds of feet between each successive contour line. The contour interval allows the map reader to instantly know the relative steepness & flatness of the topography in the map at one quick glance. Because of this crucial information, a topographic map is considered incomplete when it does not disclose this information to the reader.
Enter the Terrain feature of Google Maps. Released to the public in November of 2007, the contour lines were subsequently added in April of 2008. I hadn’t really given the feature much use until last week when I was planning my weekend excursion to the Shenandoah mountains. I was trying to figure out the altitude variation on my friends property by finding where their property line started & ended and calculating the elevation change. Since their property lies on the side of a mountain, I wanted to know the altitude at the bottom of the property and the altitude of the highest portion of the property, and subtract the difference to find the total elevation variance.
What I found out instead was that Terrain function of Google Maps was lacking the contour interval declaration in the legend. As with all their maps, the lower left-hand corner showed the units of distance on the map, but was missing the topographical information provided by the contour interval declaration.
In lieu of ever getting a response from Google Maps after previous queries, I decided to send a tweet to Google Maps:
I wasn’t really expecting a response, but a couple hours later I received this response on Twitter:
+ MORE